This web page was produced as an assignment for an undergraduate course at Davidson College.
My Favorite Yeast Gene Expression
By Jessica Lahre
How a protein’s expression pattern changes due to changes in its environment can give a lot of insight into the protein and its encoding gene. Both genes, SSH1 and YBR285W, are located in the same region of Chromosome II of Saccharomyces cerevisiae. SSH1, an annotated gene, is not an essential gene that encodes for the alpha subunit of the SSH1 Translocon Complex of the Endoplasmic Reticulum. Its function involves co-translational targeting, protein transport, and maintenance of chromosomal telomeres. YBR285W is an unannotated gene, so its biological process, cellular component, and molecular function are unknown. From the previous website, I found that the protein that YBR285W gene encodes for has no transmembrane domains and predicted that it could possibly function in the Golgi Complex with sorting, packaging, and transporting due to the high identity to YJL029C, a potential paralog. It is known that systematic deletion of the gene allows the cell to still be viable, thus it is not an essential gene.
Microarray technology using DNA allows researchers to examine the transcriptional patterns of a variety of genes under specific environmental conditions. Using PCR, all 6,200 yeast genes are amplified, and then the DNA is "spotted" onto a slide with covalent bond. cDNA probes are created from the mRNA expressed in two different experimental conditions, and they are marked with either red (experimental) or green (control) fluorescent probes. The two sets of cDNA are then allowed to hybridize with the slide, and washed. The chip is then sent through a scanner, which uses light to detect the dyes and their relative locations and intensities. A computer then analyzes the two color images to form an image with varying shades of green, red, and black spots, according to protein expression (Campbell & Heyer 2007). Thus microarray data poses as a valuable tool to provide potential characteristics of proteins and their genes. This website will use microarray data to show how the information from this technology supports or refutes the previously stated function of SSH1 and YBR285W.
Below is the color scale used to measure the degree of repression and induction from the light intensity of the fluorescent dye from the slide hybrid images. For this website, green dye is the control and red dye is the experimental condition. Therefore a green bar is repression or a decrease in gene expression and a red bar is induction or an increase in gene expression based on the particular experimental condition being tested (Campbell & Heyer).
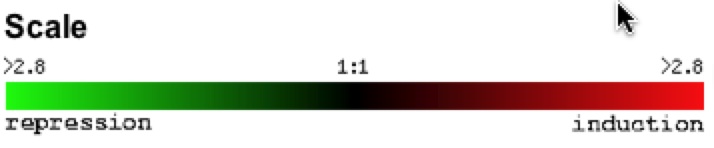
Figure 1. Color scale of gene expression. Red color indicates induction and green dye indicates repression has occurred. The numbers are fold ratios, so red 2.8 brightness means a 2.8 fold of induction/repression. (Expression Connection 2006)
Annotated Gene: SSH1/YBR283C
Repression:
Expression in Response to Histone Depletion
Wyrick et al. in 1999 found that there was repression of SSH1 gene during histone depletion of equal to or greater than 2 hours. The researchers depleted the nucelosomal histones and silencing factors in their experimental yeast cells. Genes that were repressed were associated with the silencing of the SIR complex, thus affectively silencing the telomeres (Wyrick et al. 1999).

Figure 2. Summary of the results about SSH1 mRNA expression under histone depletion conditions over time (Expression Connection).
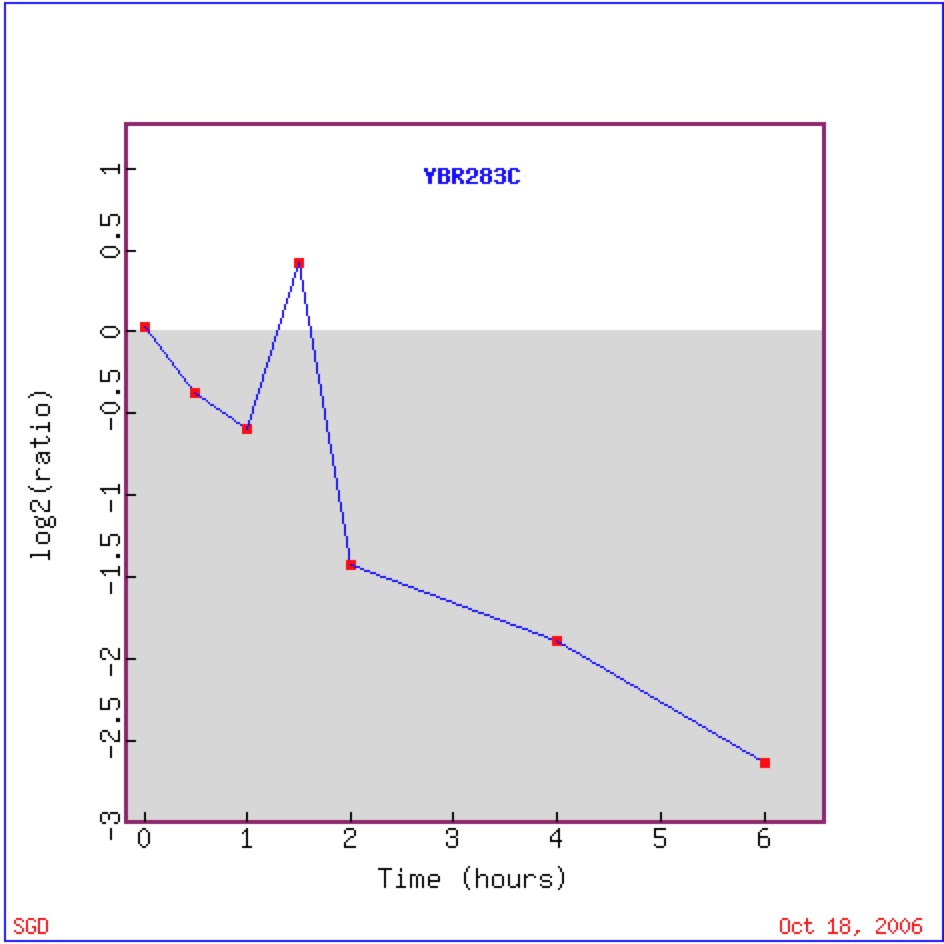
Figure 3. Graphical representation of the shift from repression to induction to repression to induction of SSH1 during histone depletion experiment. Log2 (ratio) is equivalent to the Log2 (red/green). Negative values (below shade) of Log2 (ratio) indicate green or repression, while positive values (above shade) indicate red or induction.
There are other genes that show a similar expression pattern under histone depletion over time (figure 4). Some annotated genes have a similar role to SSH1 more related to ribosomes and translation rather than telomeres. Such annotated genes are RPL35A, PRS4, RPS11A, and RPS6B (Expression Connection). SSH1 also clustered with unrelated genes, which could just mean that these genes simply react similarly to histone depletion conditions, and have no functional relationship. It is difficult to know whether guilt by association is accurate in this instance.
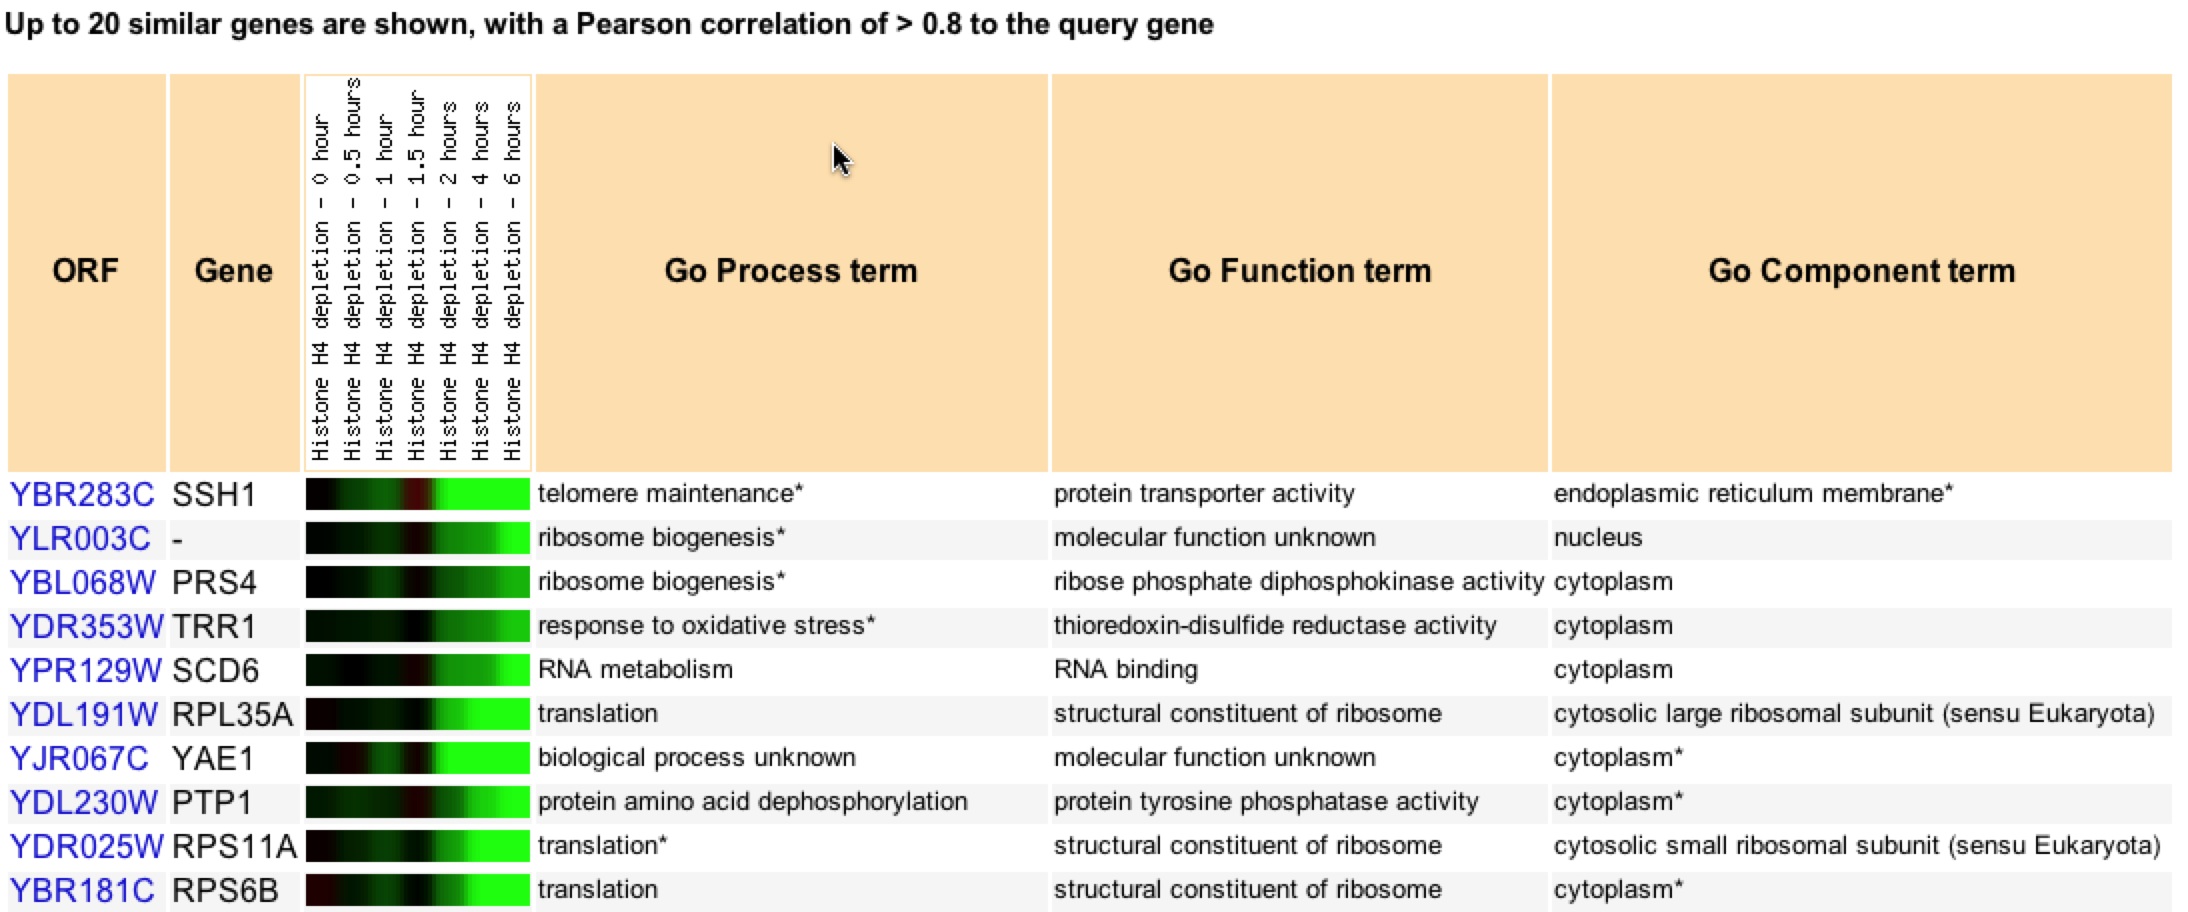
Figure 4. Clustering of genes that have similar expression patterns to SSH1 under histone depletion conditions over time (Expression Connection).
Induction:
A. Expression in Response to Alpha-Factor Under Various Concentrations
Roberts et al in 2000 found that there was strong induction of SSH1 during almost all concentrations of alpha factor. The researchers were studying the MAPK pathways of signal transduction pathways (Roberts et al 2000). Induction of SSH1 to the alpha factor concentrations supports the belief that SSH1 is involved in telomere maintenance and its clustering with similar gene support SSH1’s molecular function and cellular component through guilt by association.

Figure 5. Summary of the results about SSH1 mRNA expression in response to alpha factor under various concentrations (Expression Connection).
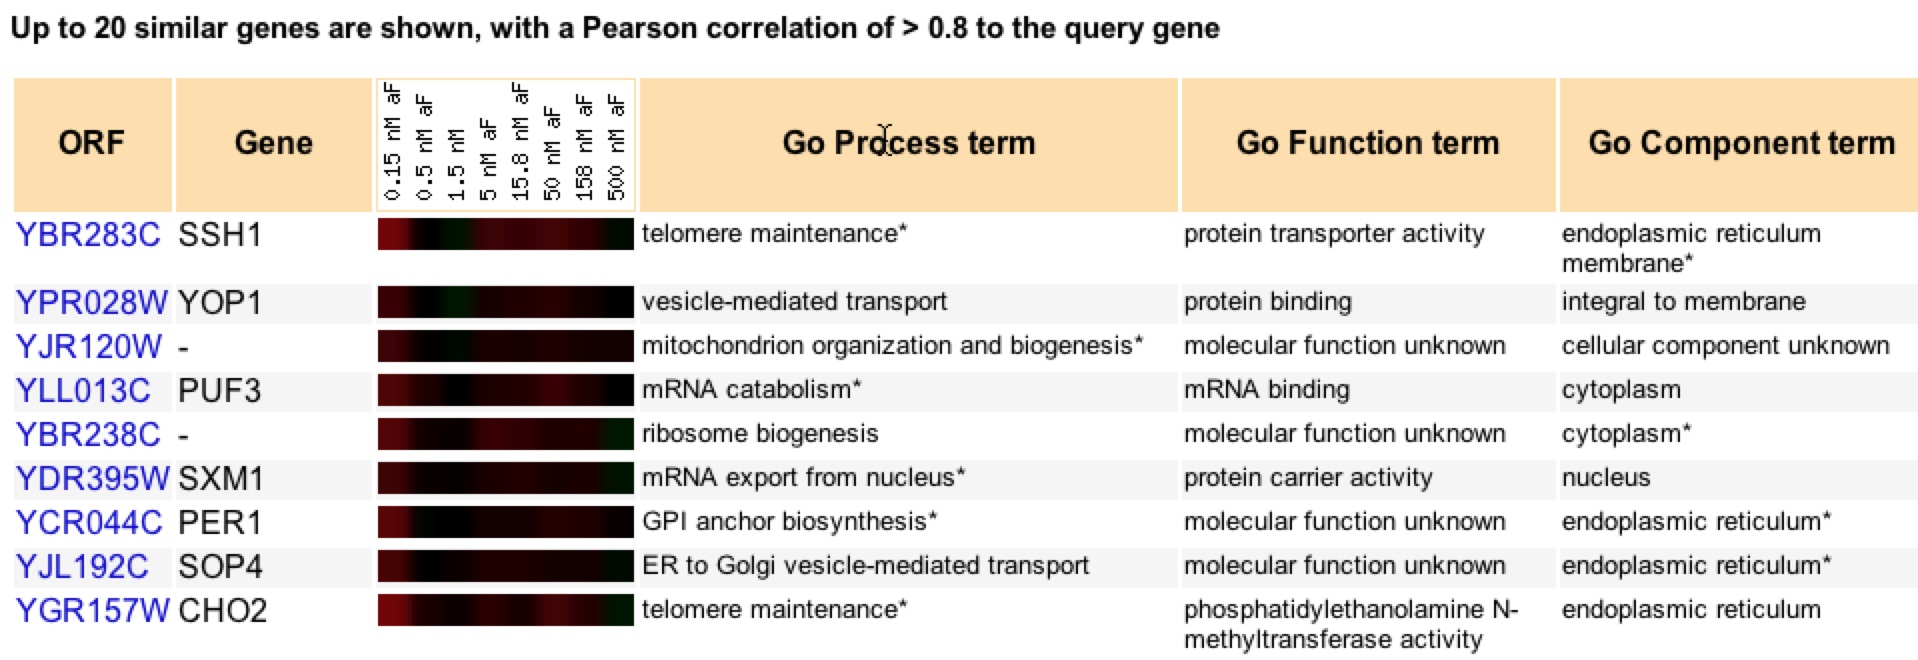
Figure 6. Clustering of genes that have similar expression patterns to SSH1 in response to alpha factor under various concentrations (Expression Connection).
Looking at figure 6, one cannot only see the color scheme similarities but also the “GO term” matching. SSH1 and CHO2 both are involved in telomere maintenance, while SSH1, PER1, SOP4, and CHO2 all are located in the ER. SXM1 seems to be involved in protein transportation/carrying like SSH1 (Expression Connection). The alpha factor experiment provides strong evidence for both cellular component and biological process of SSH1 using guilt by association.
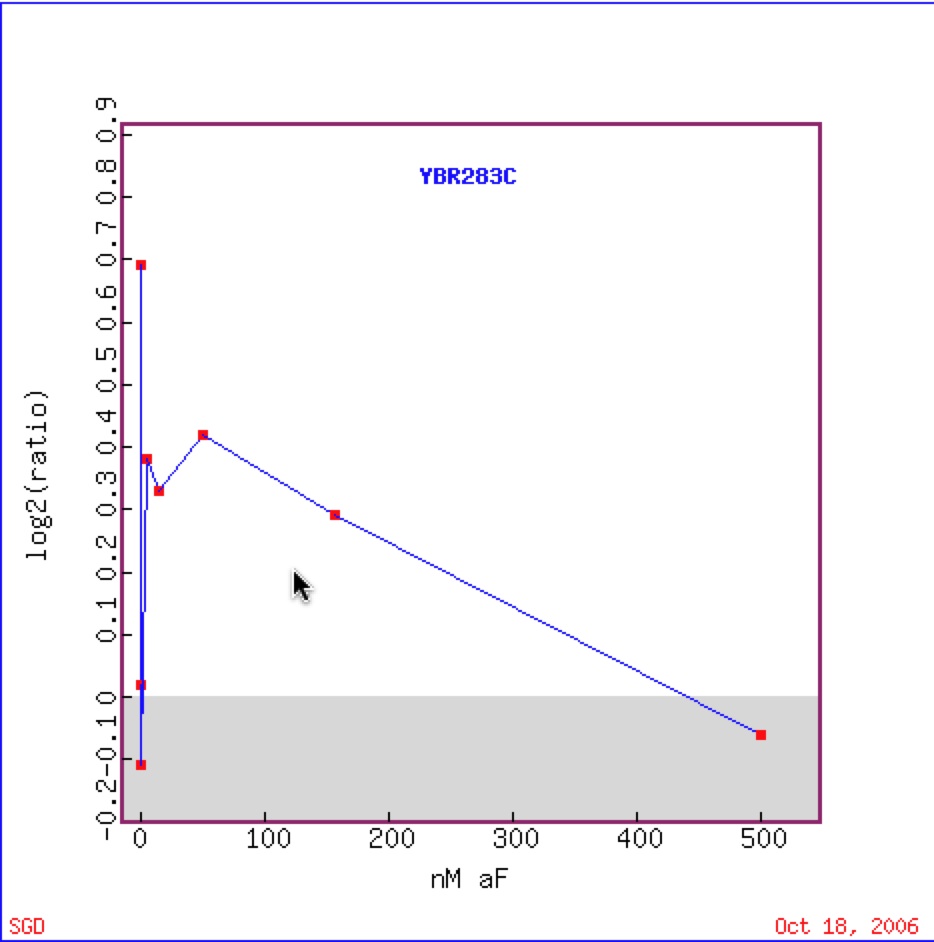
Figure 7. (Move to be 6) Graphical representation of the shift from repression to induction to repression to induction of SSH1 in response to alpha factor under various concentrations (Function Junction).
C. Large-scale identification of secreted and membrane-associated gene products using DNA microarrays.
Diehn et al.’s study in 2000 shows strong evidence that SSH1 is a membrane bound protein. Cytosolic and membrane bound fractions of proteins were studied using microarrays and then clustering them to known cytosolic and membrane bound proteins encoded by yeast and human genes (Diehn et al. 2000). The strong induction indicates that that SSH1 is a membrane bound protein and is consistent throughout the experiment.
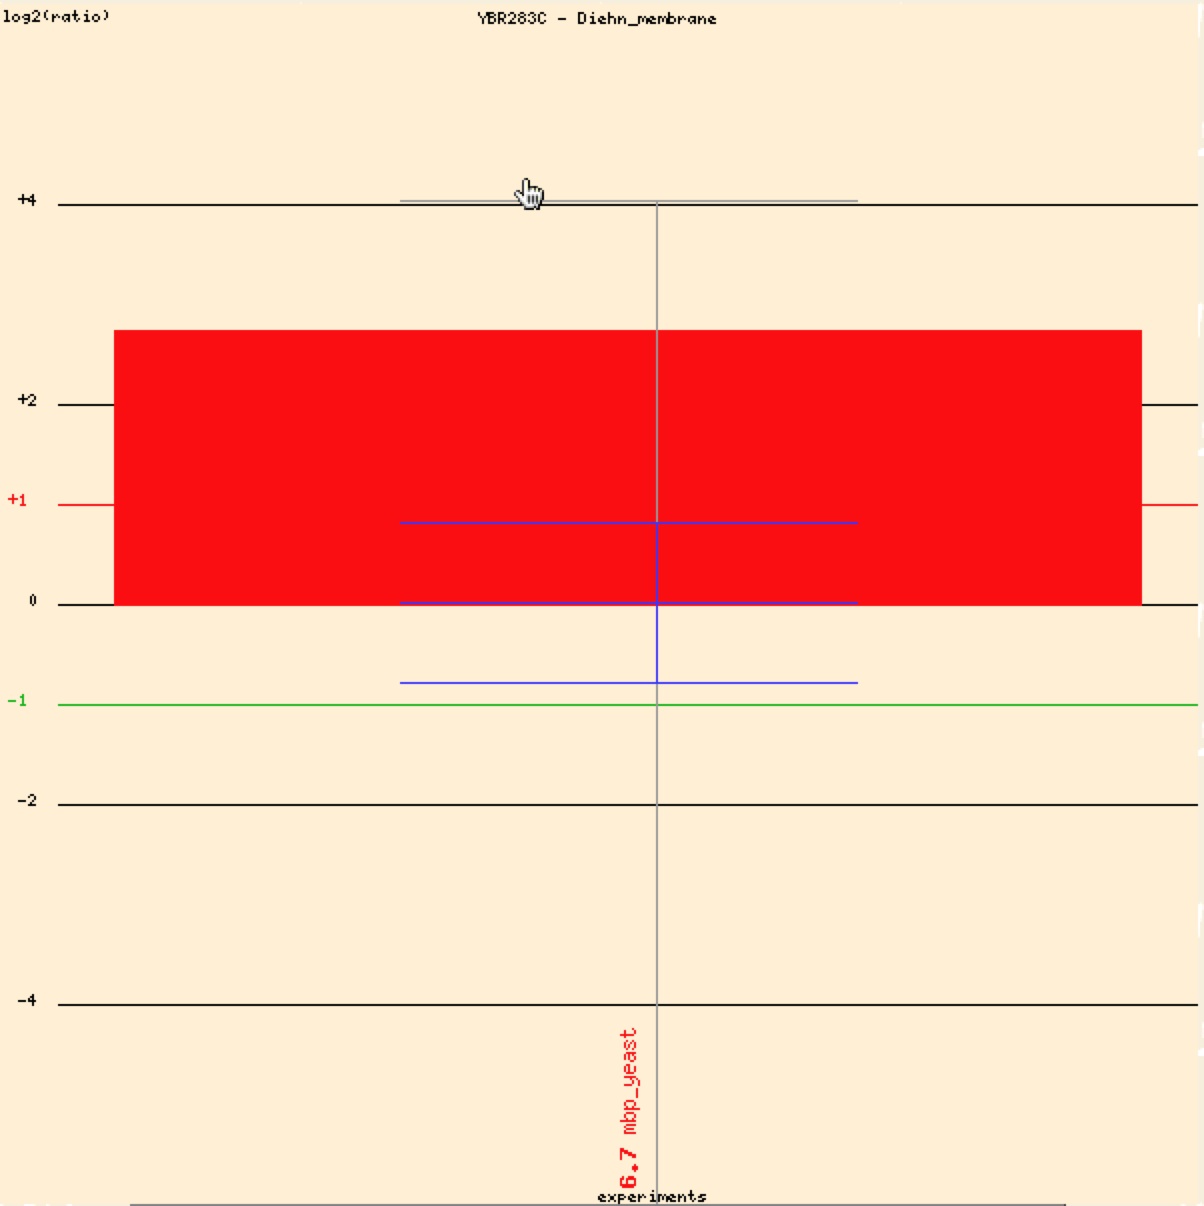
Figure 8. Graphical representation of SSH1 induction based on Diehn microarray data. Positive values or red values indicate induction or over expression under the specific conditions (Function Junction: SSH1 2006)
D. Microarray analyses of the metabolic responses of Saccharomyces cerevisiae to organic solvent dimethyl sulfoxide.
Zhang’s group in 2003 gave cells a high concentration of dimethyl sulfoxide (DMSO) to see how the stress effected different genes’ expression patterns. If repressed most of the clustering indicated possible pathways to lipid synthesis, while induction clustering showed that most genes were involved in protein/amino acid synthesis. Figure 11 shows an induction/red signal indicating that SSH1 is involved in amino acid production.
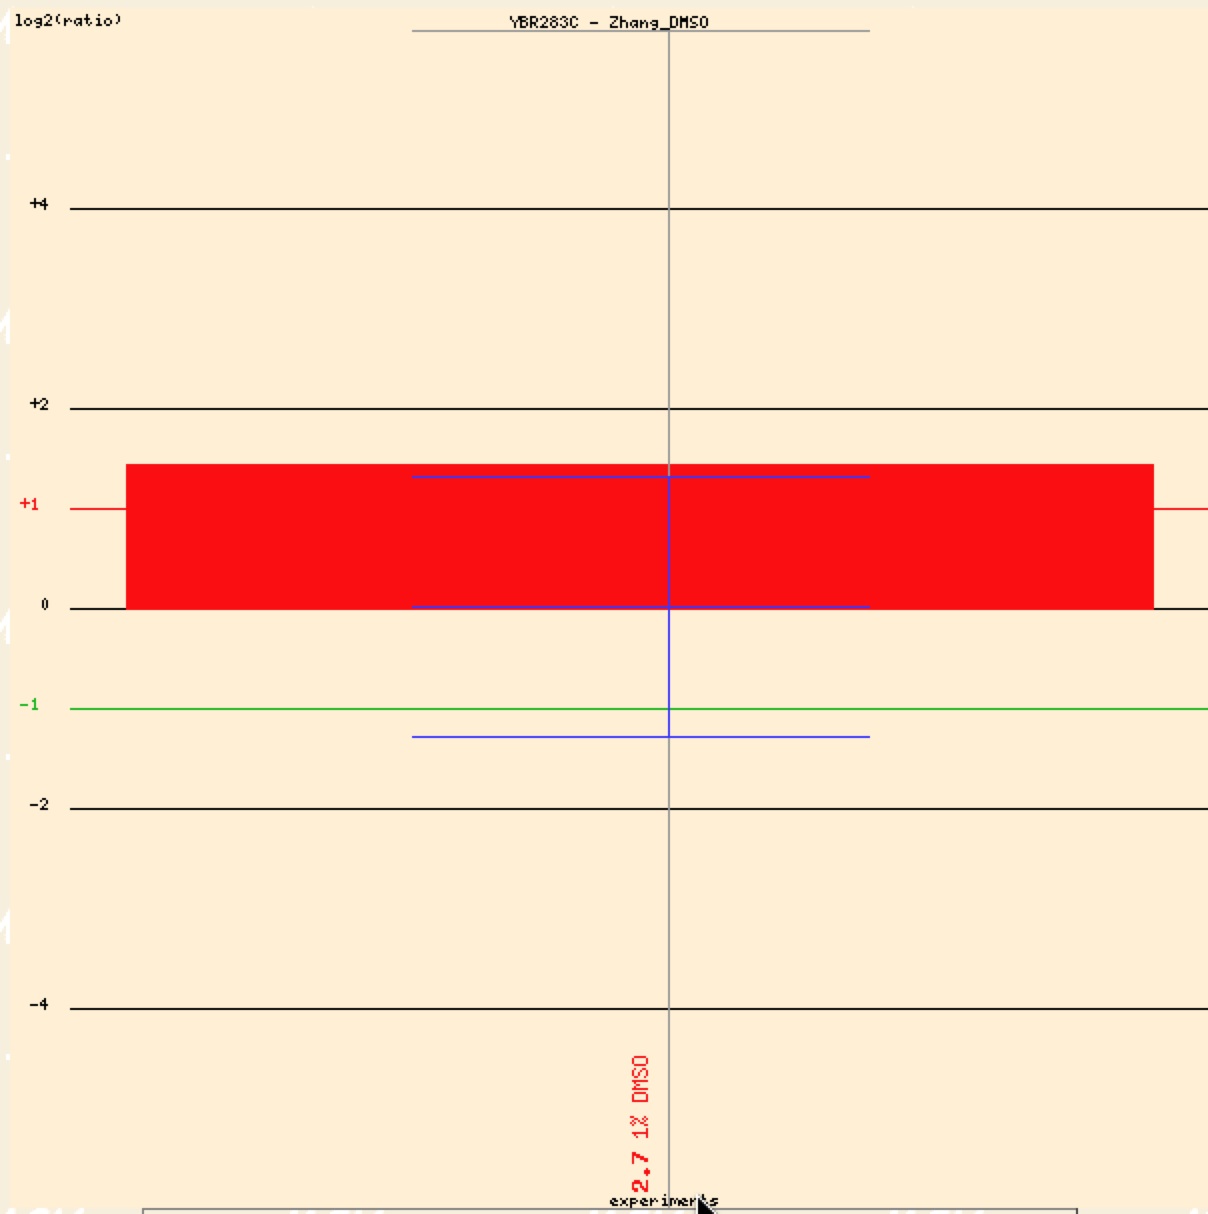
Figure 9. Graphical representation of SSH1 induction in response to presence of DMSO (Function Junction).
In conclusion the above microarray data strongly support the previous website and its claim that SSH1 is involved in protein production, transport, and telomere maintenance. Wyrick et al. and Robert et al. gave strong evidence that SSH1 is involved in some way with telomeres and that SSH1p is located in the ER and involved with protein transport activity. Diehn et al. and Zhang et al. confirmed that SSH1 was membrane bound and involved in amino acid synthesis.
Unannotated Gene: YBR285W
Repression:
A. Expression In Response to Arsenic
Arsenic is a toxic pollutant that affects cell proliferation and oxidation (Expression Connection). When arsenic was present, YBR285W showed repression through most of the time and dosages as shown in figure 12. Then when YBR285W was clustered with other annotated and unannotated genes, figure 13, one can try to deduce the possible function of the YBR285W protein. Using guilt by association one might guess that YBR285W could either be located in the cytoplasm or ER. The fact that SSH1 and YBR285W are both located on chromosome II makes me lean towards ER. Using this cluster one might guess that YBR285W could be involved in metabolism whether it be protein glycosylation or phosorylation or glycolysis. One cannot make an accurate looking at just this microarray clustering.

Figure 10. Summary of the results about SSH1 mRNA expression in response to arsenic (Expression Connection).
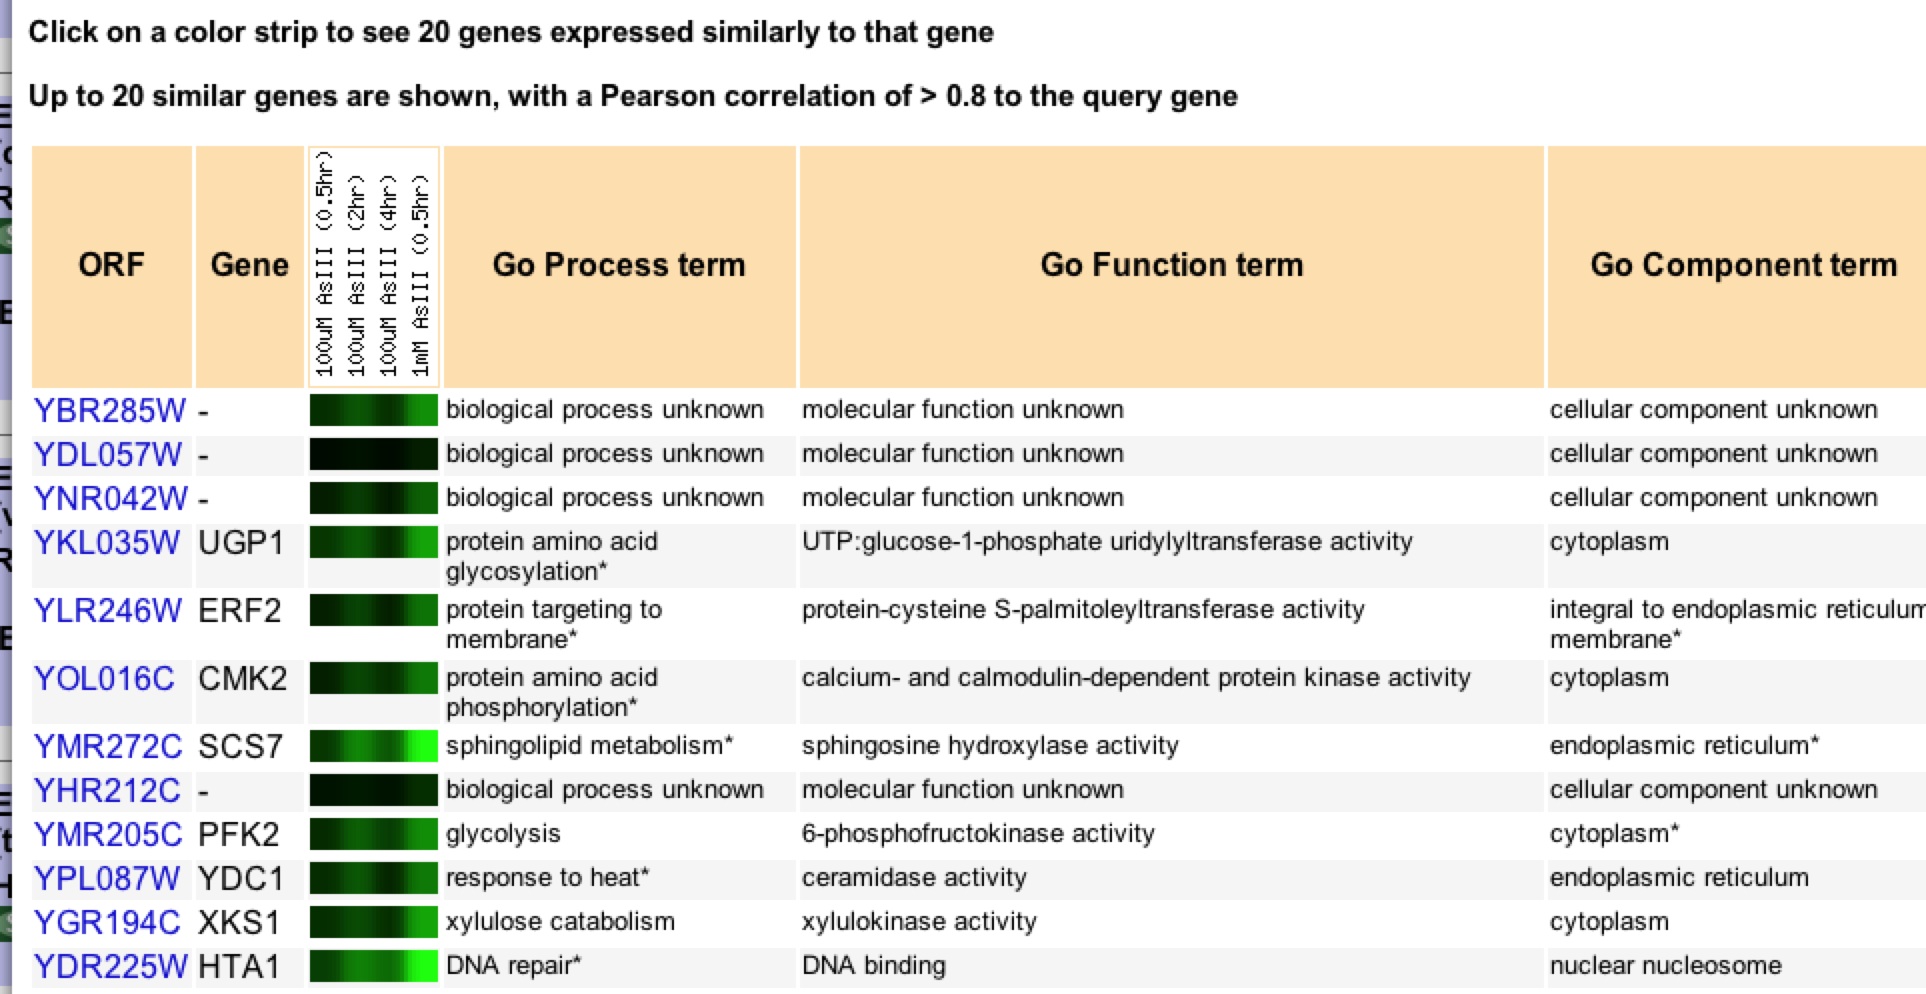
Figure 11. Clustering of genes that have similar expression patterns to SSH1 in response to arsenic (Expression Connection).
B. Microarray analyses of the metabolic responses of Saccharomyces cerevisiae to organic solvent dimethyl sulfoxide.
This is the same group and experiment as done with SSH1. Contrary to SSH1, YBR285W was repressed in the presence of DMSO. Thus this data would support that YBR285W is involved with pathways related lipid synthesis and activity.
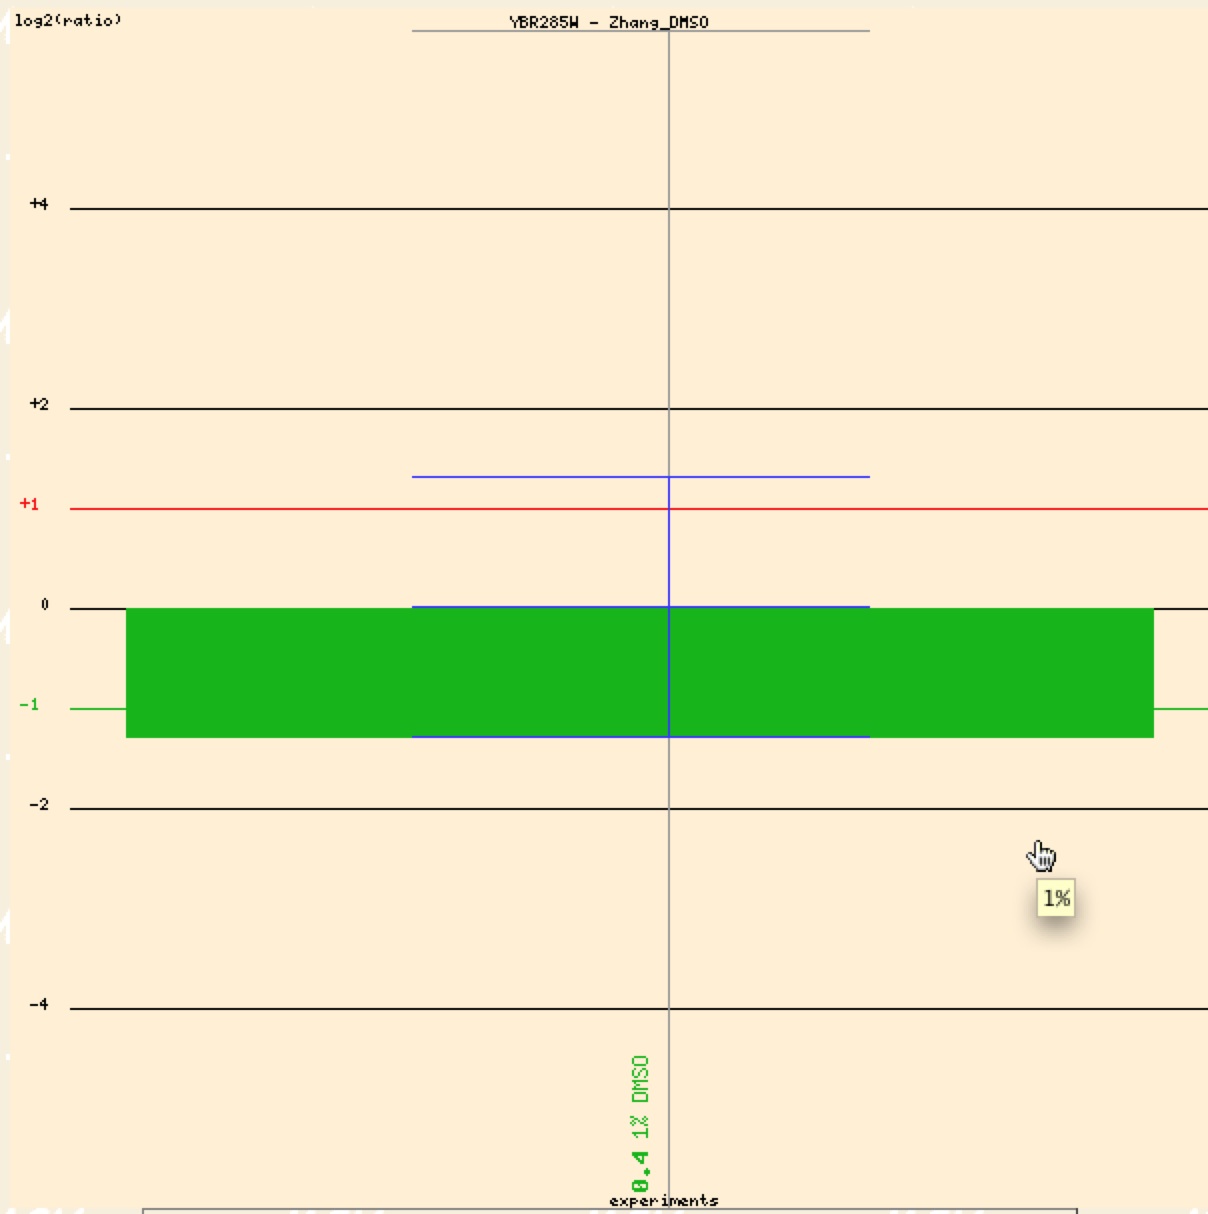
Figure 12. Graphical representation of YBR285W repression in response to presence of DMSO (Function Junction).
Induction:
A. Expression During Sporulation
Chu et al.’s experiment in 1998 should that at almost all time slots during sporulation YBR285W was induced. Thus in response to adverse condition YBR285W could be induced to provide energy for asexual reproduction of the yeast cell (Chu et al. 1998)

Figure 13. : Summary of the results about YBR285W mRNA expression in response during sporulation (Expression Connection).
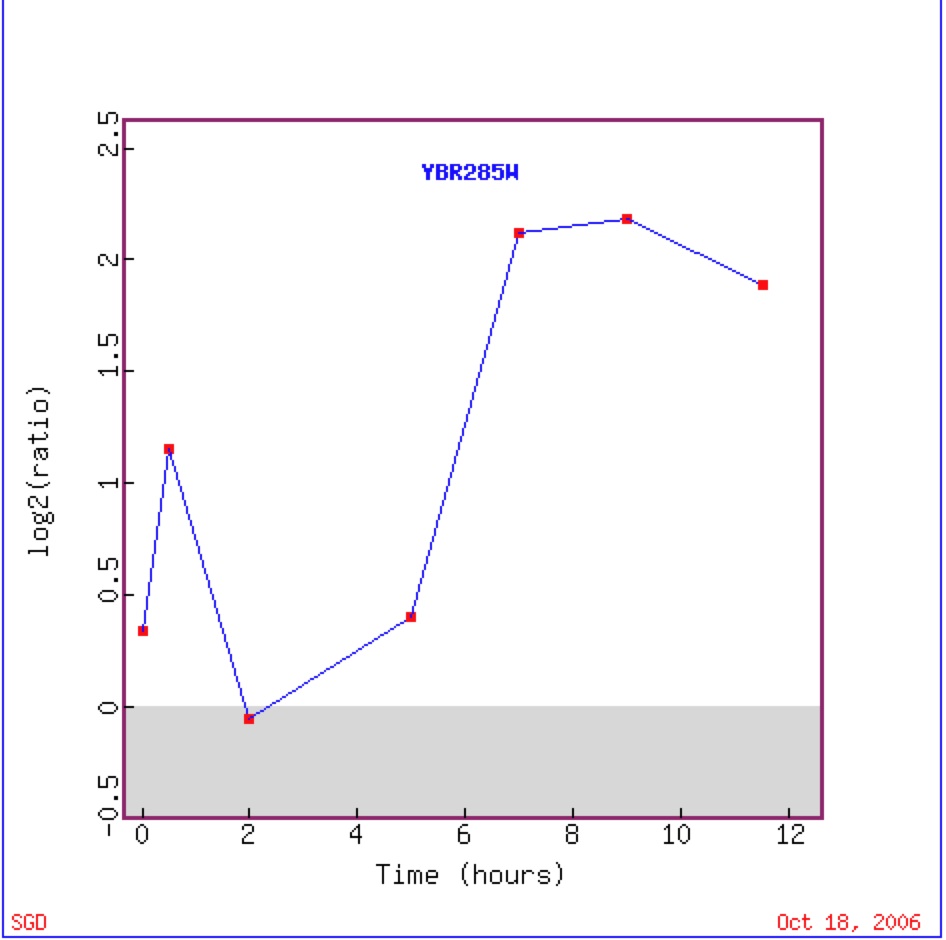
Figure 14. Graphical representation of the shift from repression to induction to repression to induction of YBR285W during sporulation (Expression Connection).
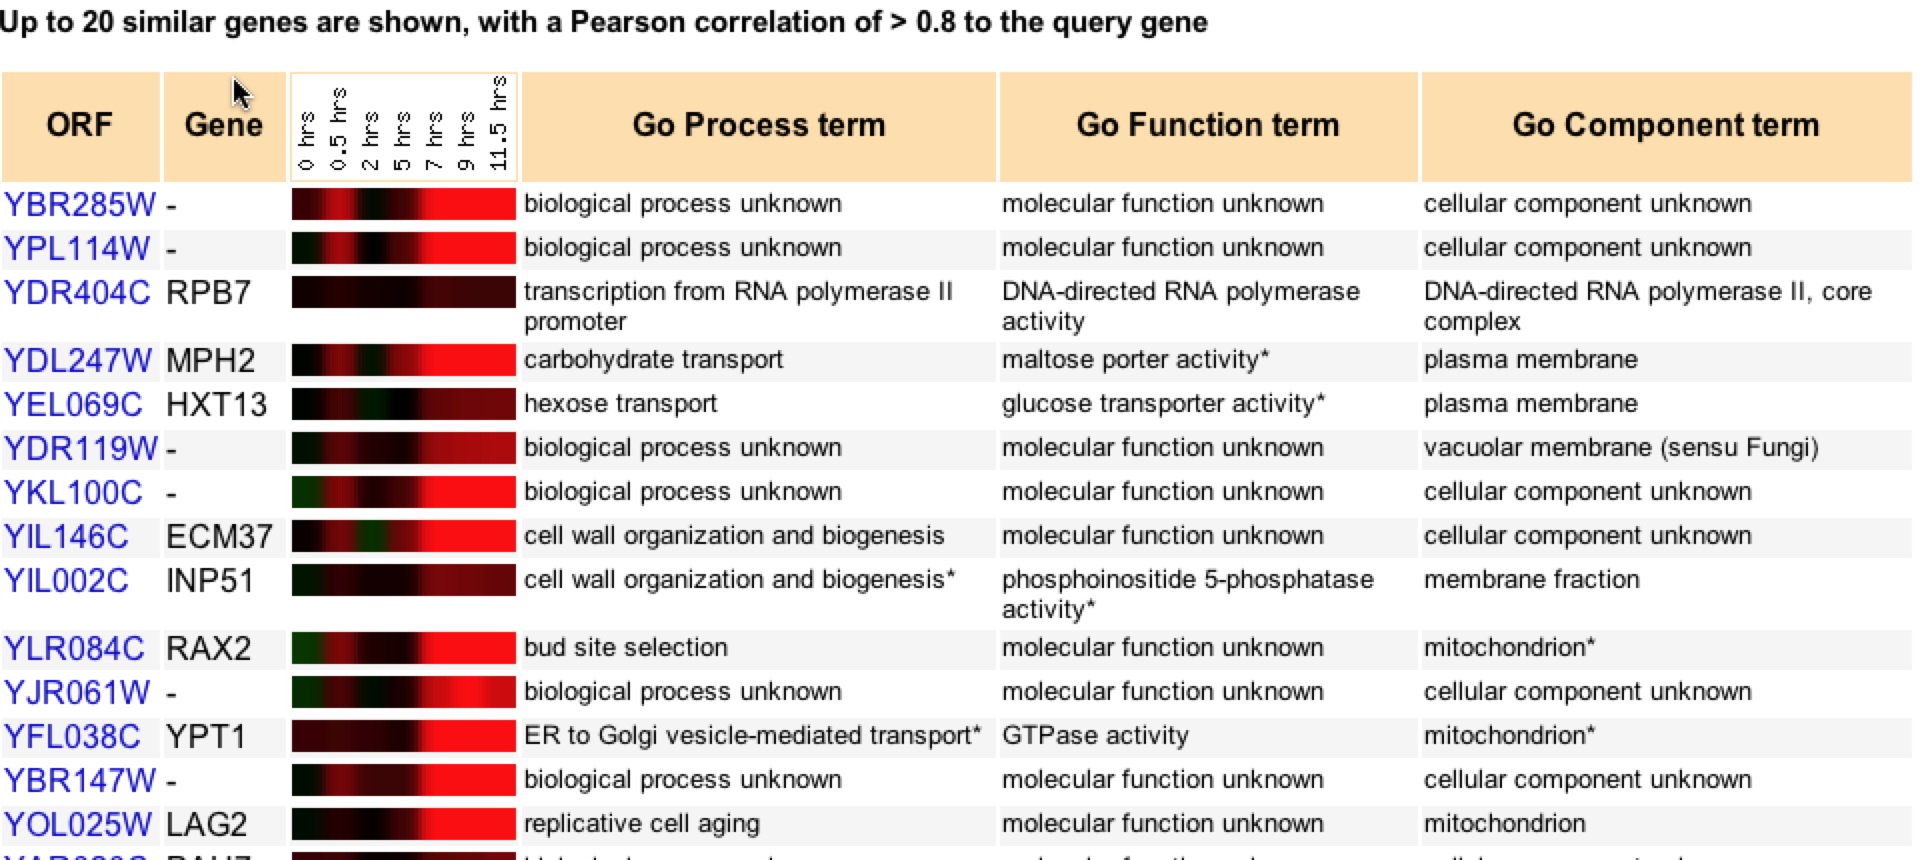
Figure 15. Clustering of genes that have similar expression patterns to YBR285W during sporulation (Expression Connection).
The clustering of YBR285W in figure 17 supports the idea that it is involved with metabolism and possible biogenesis of some sort. The fact that it clustered with ECM37 and INP51, which are both involved with cell wall organization and biogenesis further supports the lipid pathway idea (Expression Connection). It also supports the vacuolar activity with the organizing and sorting of molecules before transporting to its desired destination
B. Transcriptional, proteomic and metabolic response to lithium in galactose-grown yeast cells. (bro-litium)
Bro et al. in 2003 studied the effects of the presence of lithium over time on yeast cells. YBR285W was induced in the presence of lithium as seen in figure 18. Genes with known that were also induced with lithium clustered together and seemed to have similar energy reserve metabolism (Bro et al. 2003).
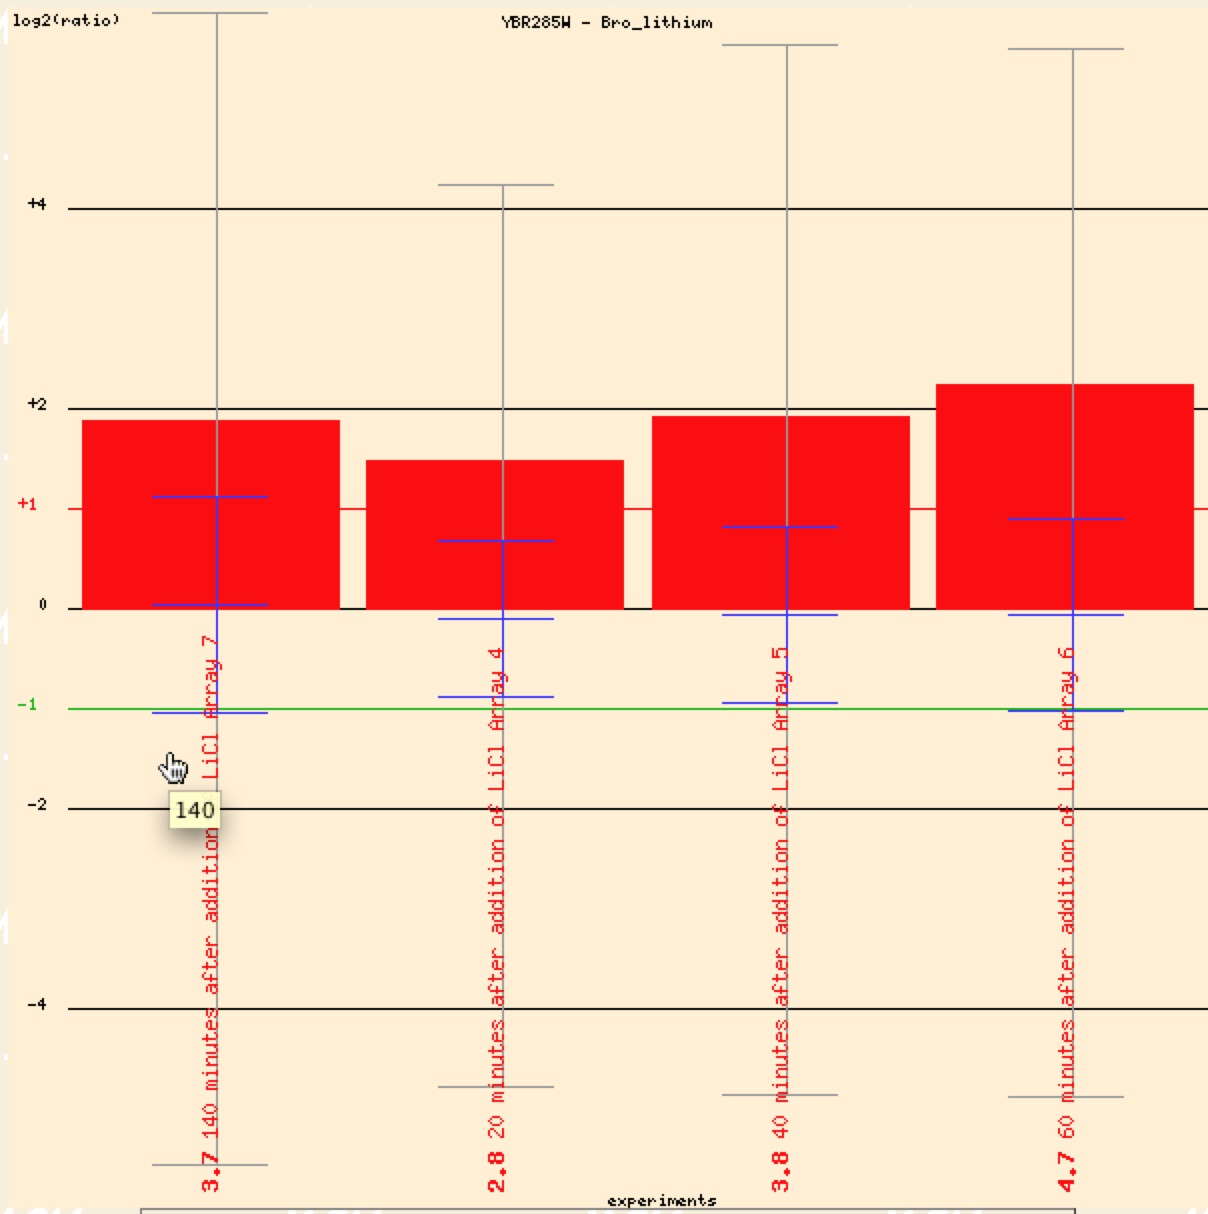
Figure 16. Graphical representation of YBR285W repression in response to presence of lithium (Function Junction).
In conclusion it is difficult to make a clear-cut decision as to what the specific function of YBR285W might be. Although we can make some predictions as to the possible pathways that the YBR285Wp is involved in. Looking at the microarray data, and using guilt by association from the clustering, I would predict that YBR285W is involved in metabolism of reserve energy, especially lipids. This would support Chu et al’s data in that it could be involved in lipid bilayer synthesis and the arsenic and DMSO condition experiments. While there was very little data supporting that YBR285W is located in the Golgi complex, I do believe that it could interact with the Golgi complex in the cytosol. Most of the data supported the previous website’s claim that this is a cytosolic protein. The information gained from DNA microarrays is immense and can be sued in future experiments to study the specific function and location of YBR285W.
References:
Bro, C. et al. (2003). Transcriptional, proteomic, and metabolic repsonses to litum in galactose-grown yeast cells. J. Biol. Chem. 278 (34): 32141-9.
Chu et al. (1998). The transcriptional program of sporulation in budding yeast. Science. 282 (5389): 699-705.
Diehn ey al. (2000). Large scale identificationi of secreted and membrane associated gene prducts using DNA microarrays. Nat. gentics. 25(1): 58-62.
Haugan, A. et al. (2004). Integrating phenotypic and expression profiles to map arsenic-response networks. Genome Biology. 5 (12):
Roberts et al. (2000). Signaling and cirsuitry of multiple MAPK pathways revealed by a matrix of global gene expression profiles. Science. 287 (5454) 873-80.
SGD. 2006 Oct. SSH1/YBR283C. <http://db.yeastgenome.org/cgi-bin/expression/expressionConnection.pl>.Accessed 2006 Oct. 18.
SGD. 2006 Oct. YB$285W. <http://db.yeastgenome.org/cgi-bin/functionJunction>. Accessed 2006 Oct. 18.
Wryick et al. (1999) Chromosomal landscape of nucleosome-dependent gene expression and silencing in yeast. Nature. 402 (6760): 418-21.
Zhang et al. (2003). Microarray analyses of the metabolic responses of Saccharomyces cerevisiae to organic solvent dimethyl sulfoxide. J. Ind. Microbiol. Biotechnol. 30 (1): 57-69.
For more information, please refer to the
Davidson College Genomics Home Page
Davidson College Biology Home Page
Back to my Home Page
E-mail me any comments or concerns
© Copyright 2006 Department of Biology, Davidson College, Davidson, NC 28035